Snow’s “Grand Experiment”
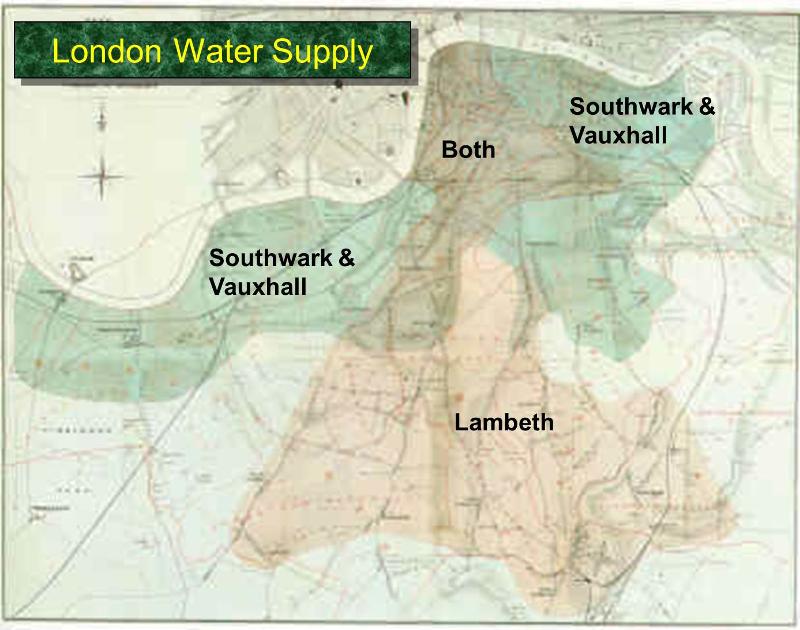
Encouraged by what he had learned in Soho, Snow completed a more thorough analysis of cholera deaths. For some time, he had been gathering data on cholera deaths in an area of London that was served by two water companies. The Lambeth water company drew its water upriver from where sewage was discharged into the River Thames. Its water was relatively clean. But the Southwark and Vauxhall (S&V) company drew its water below the sewage discharge, and thus its supply was contaminated.
The map below shows the areas served by the two companies. Snow honed in on the region where the two service areas overlap.

Snow noticed that there was no systematic difference between the people who were supplied by S&V and those supplied by Lambeth. “Each company supplies both rich and poor, both large houses and small; there is no difference either in the condition or occupation of the persons receiving the water of the different Companies … there is no difference whatever in the houses or the people receiving the supply of the two Water Companies, or in any of the physical conditions with which they are surrounded …”
The only difference was in the water supply, “one group being supplied with water containing the sewage of London, and amongst it, whatever might have come from the cholera patients, the other group having water quite free from impurity.”
Confident that he would be able to arrive at a clear conclusion, Snow summarized his data in the table below.
| Supply Area | Number of houses | cholera deaths | deaths per 10,000 houses |
|---|---|---|---|
| S&V | 40,046 | 1,263 | 315 |
| Lambeth | 26,107 | 98 | 37 |
| Rest of London | 256,423 | 1,422 | 59 |
The numbers pointed accusingly at S&V. The death rate from cholera in the S&V houses was almost ten times the rate in the houses supplied by Lambeth.